


Action Tokens Plot and SPlot - Grid for placing images into blocks
Overview
Action Tokens Plot and SPlot is a website where action token holders can place images into their plots and SPlots and view their plot's location on a grid interface. This website is built with the Next.js framework.
Problem
The main problem is finding a way to visualize all plots and SPlots on one screen in a more interactive manner. Users should easily be able to identify the location of their plots and upload their artwork images into them.
Solution
My SpeedOut team and I designed and researched a solution. We came up with a simple grid-based approach to display all the plots on the website screen. We chose Next.js, Tailwind CSS, DaisyUI, Zustand, Firebase, and Amplify to solve this problem with the website.
Design
The design of Action Tokens Plot and SPlot was based on the client's requirements and ideas. Our initial design was created using Figma. We went through several iterations before finalizing the website's design.
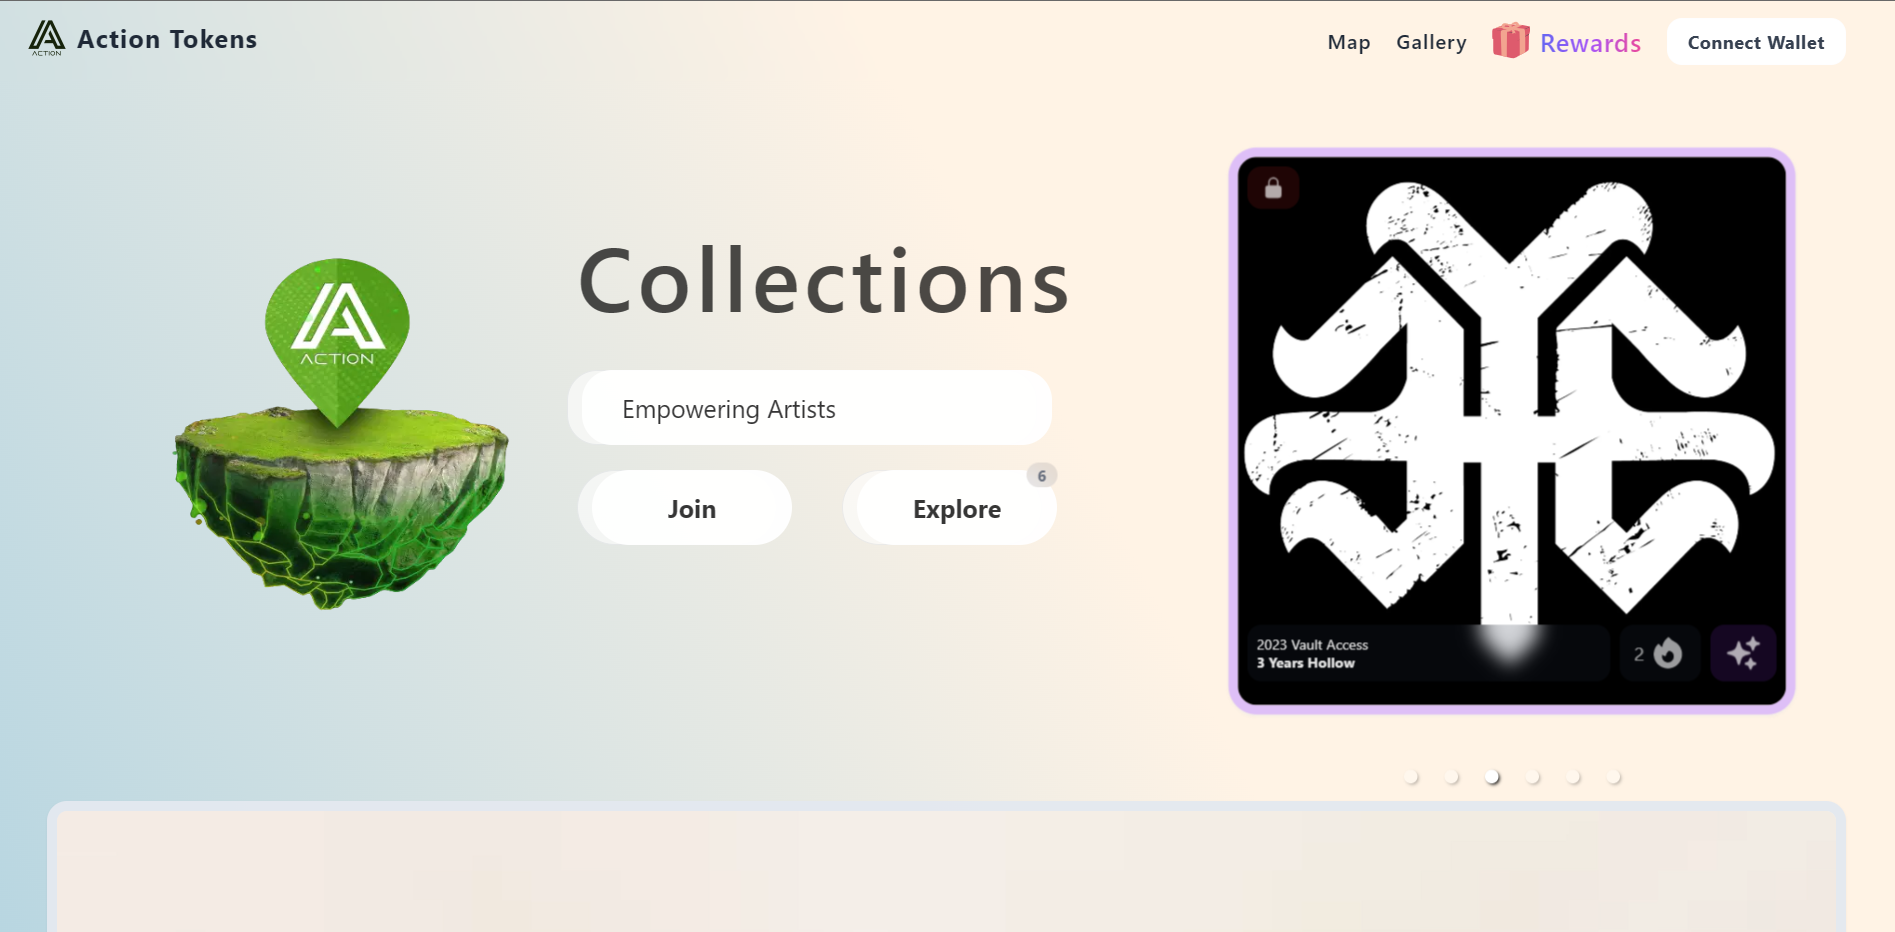
Initial Figma design
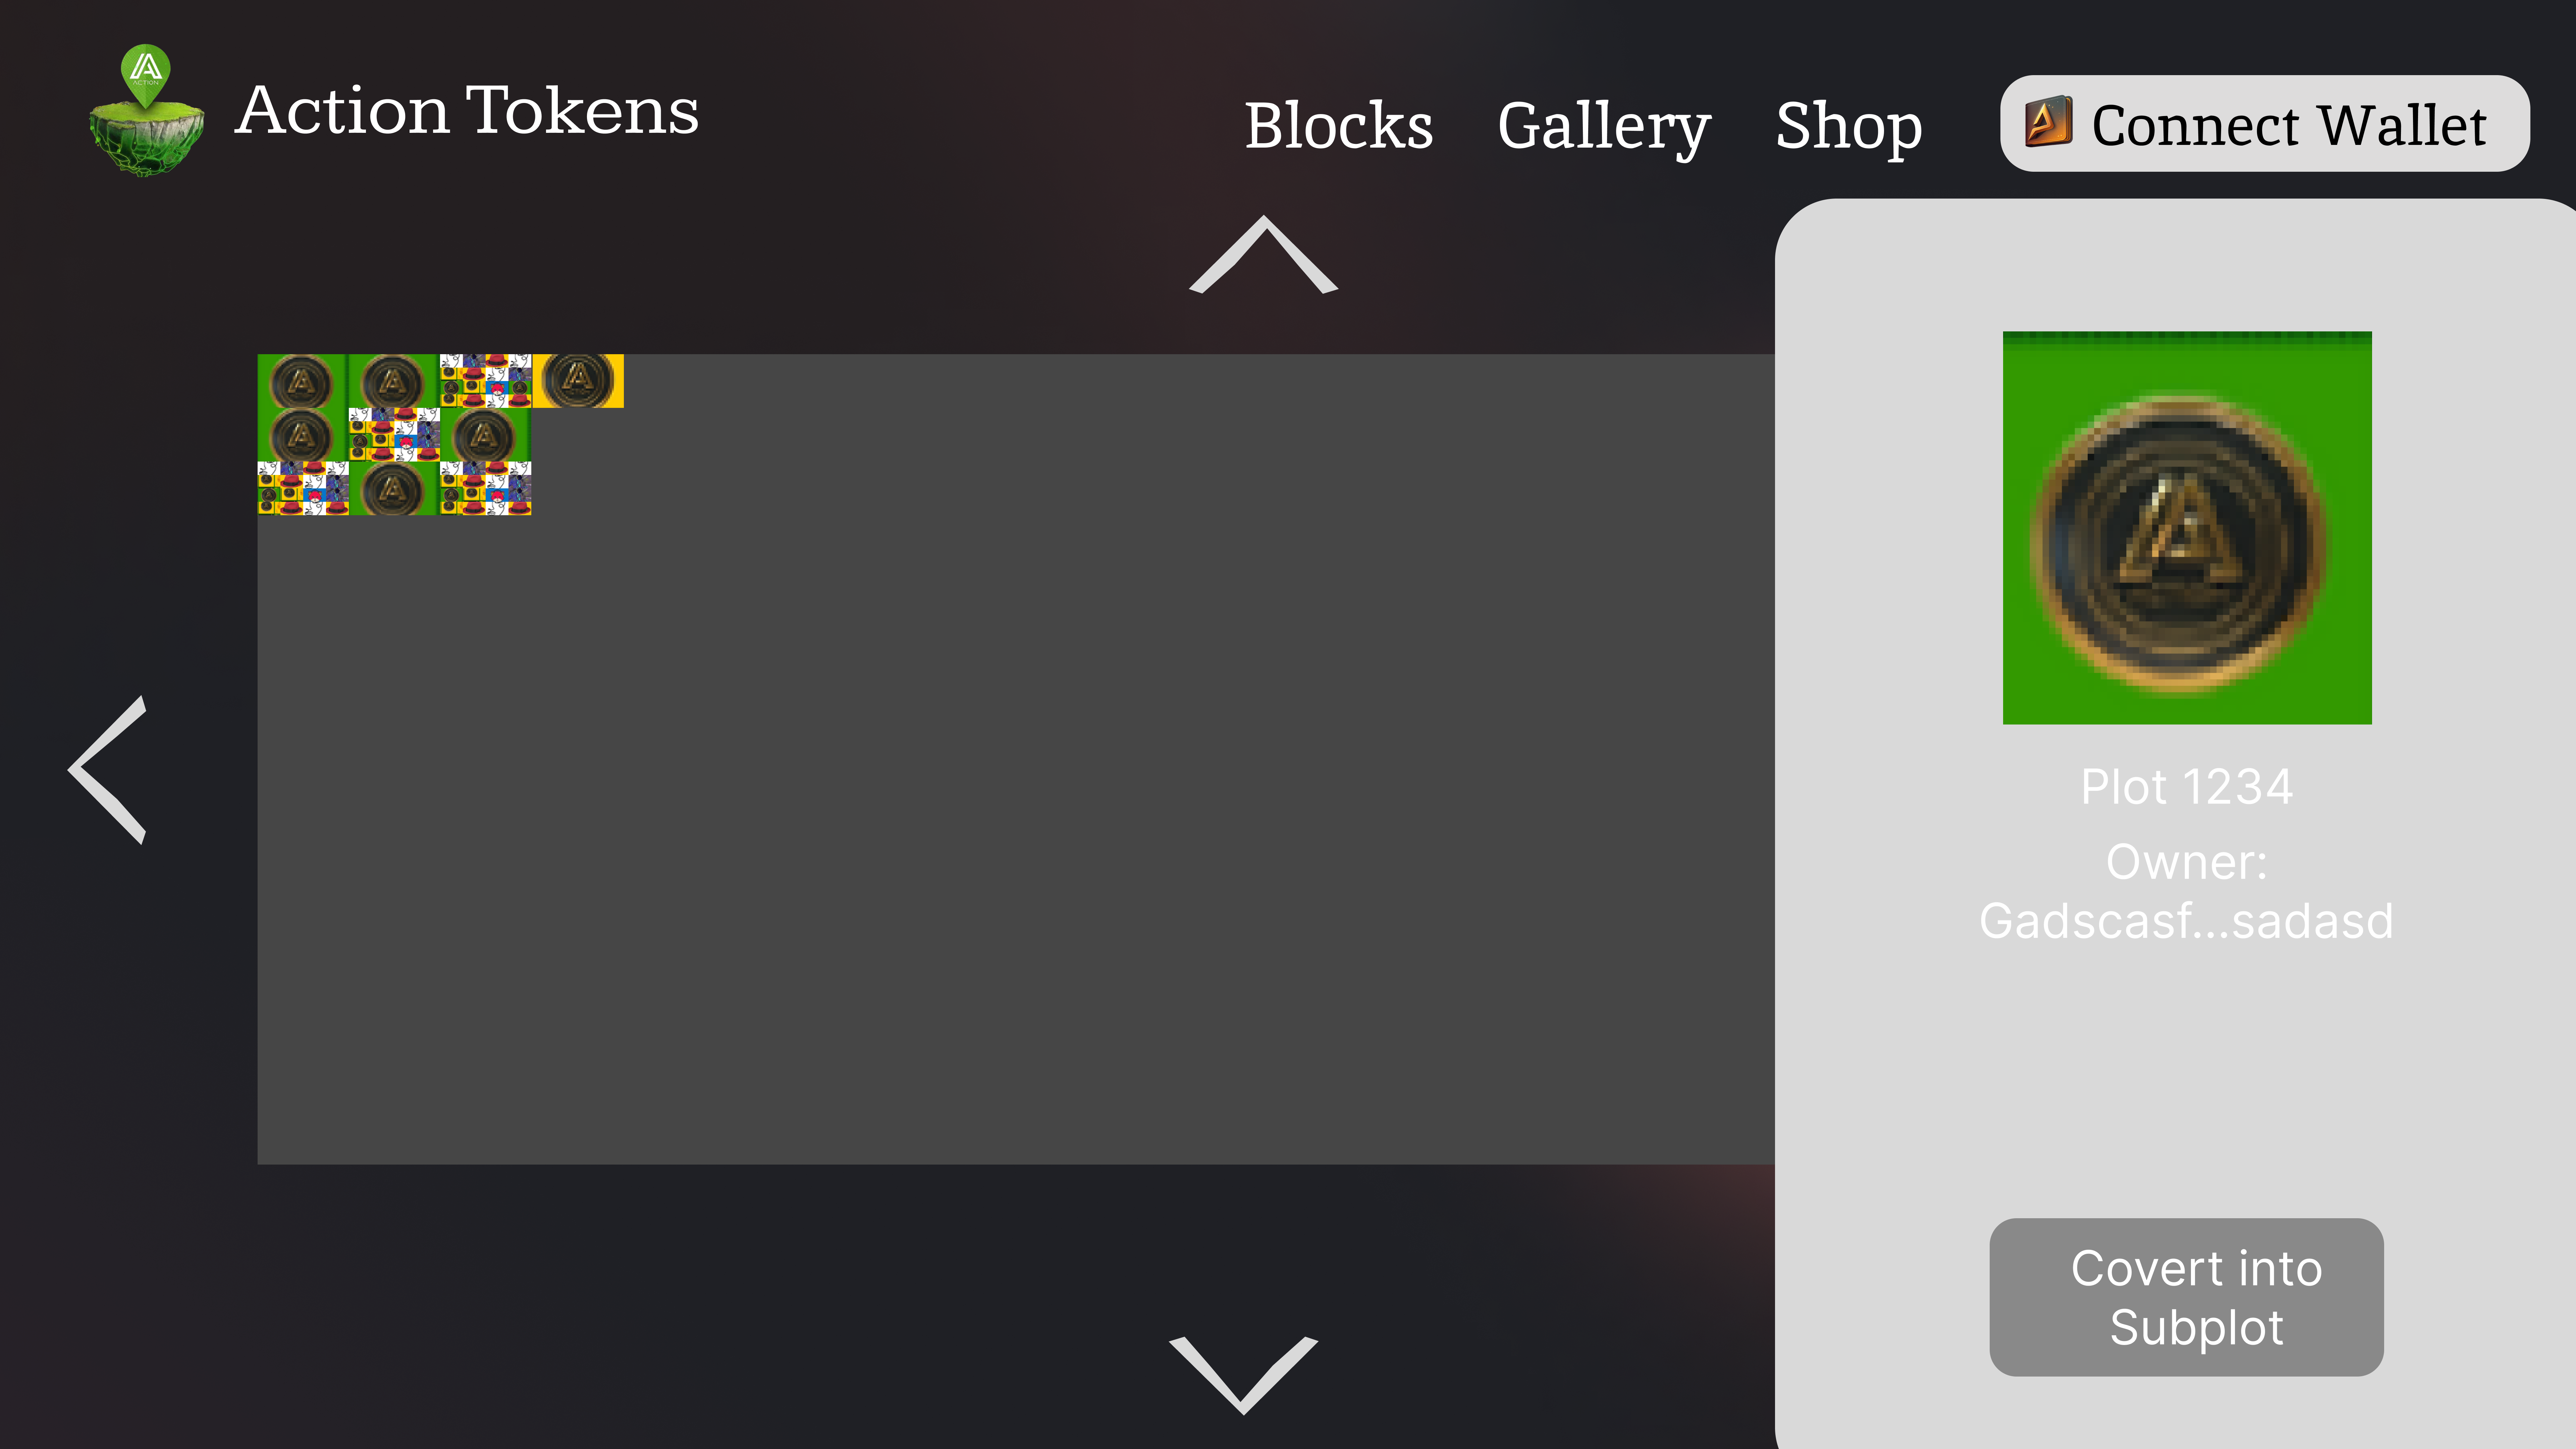
Figma map view screen design
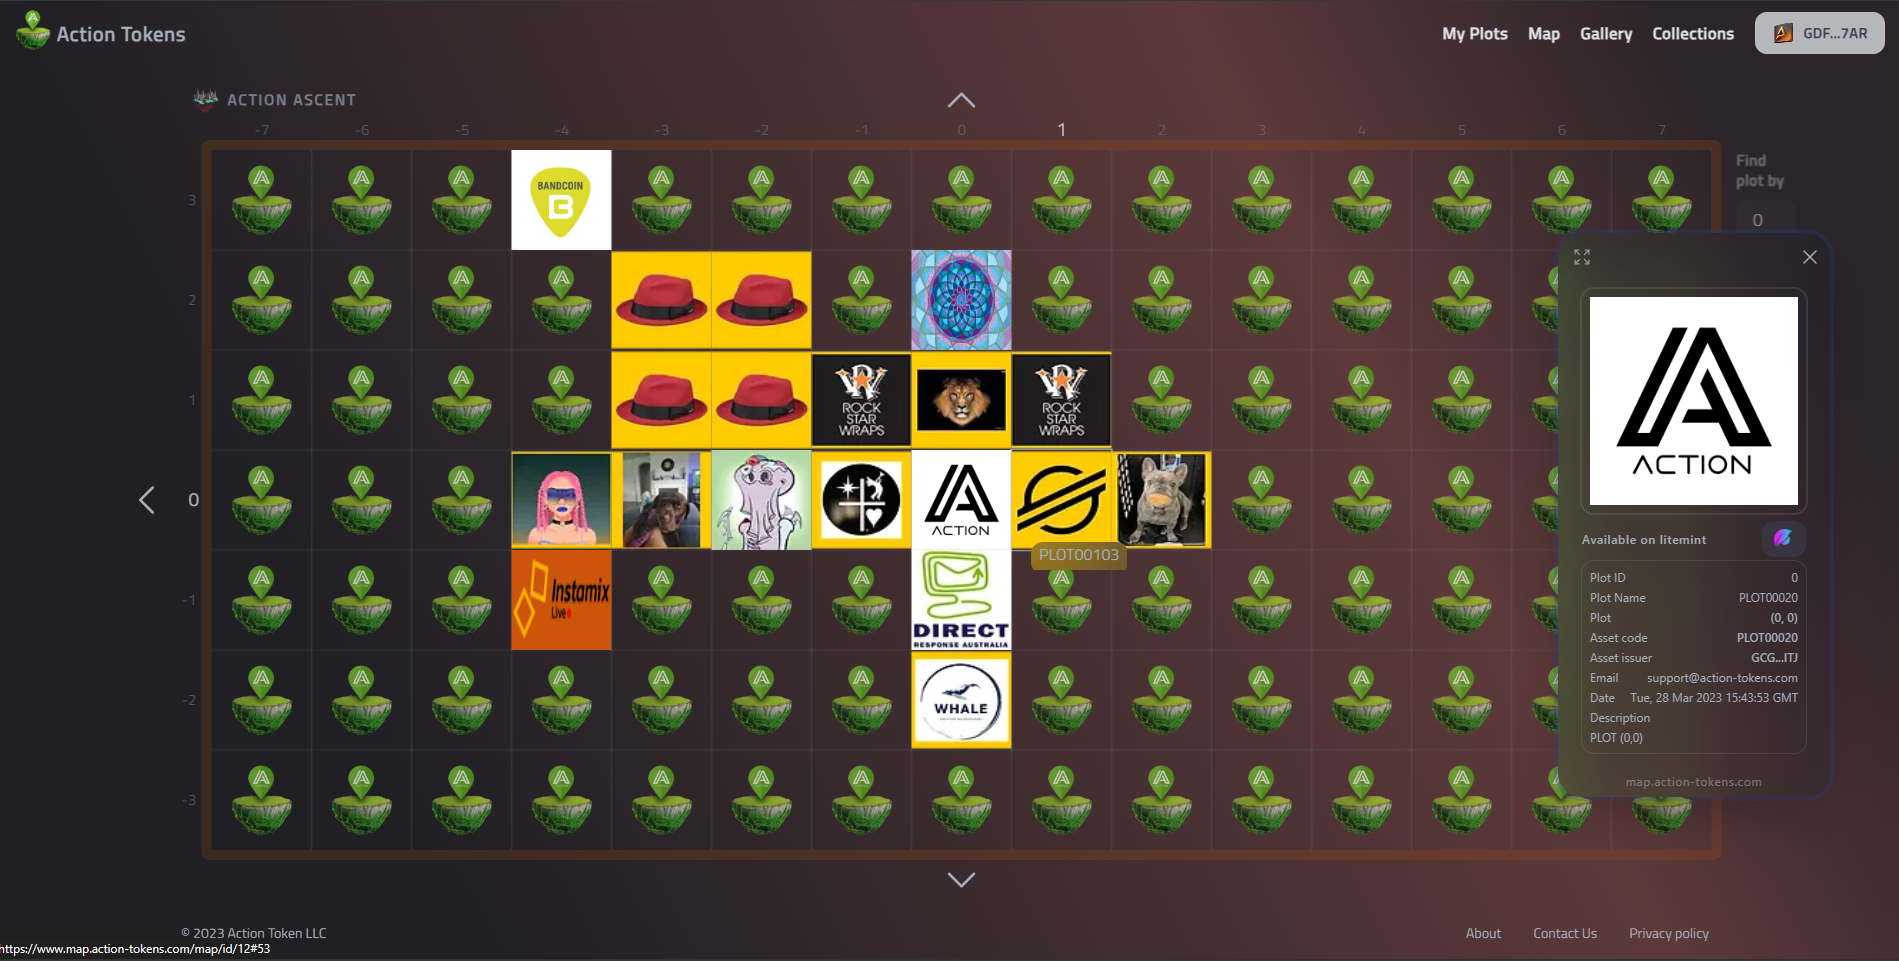
Live map view screen
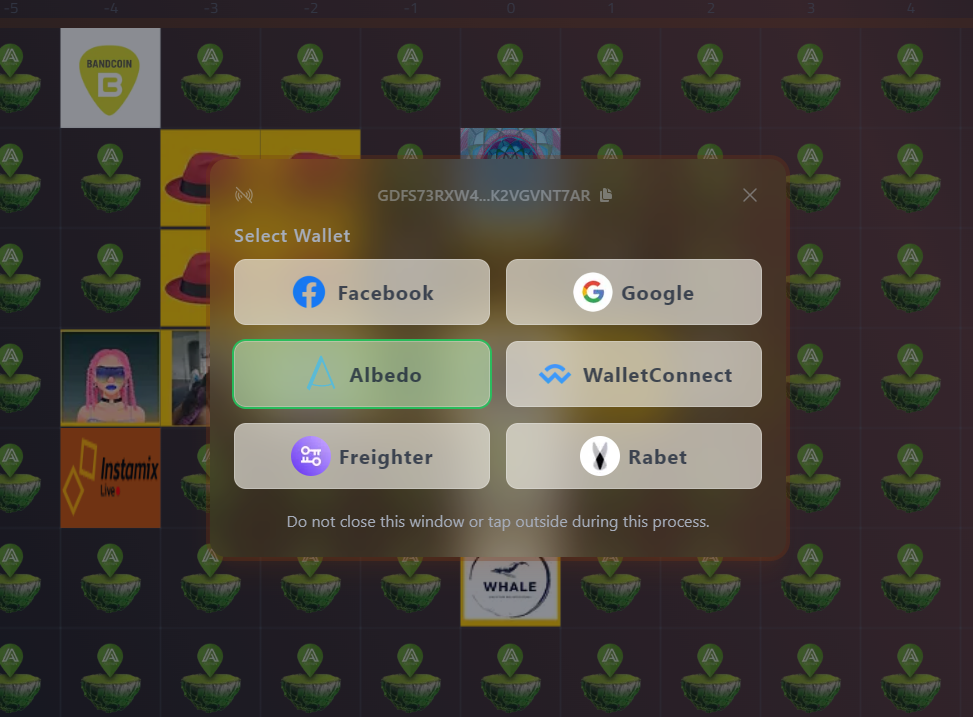
Wallet connect window
Features
- Action token plot holders can place images into their plots and SPlots.
- Supports wallet clients, including Facebook, Google, Albedo, WalletConnect, Freighter, and Rabet.
- Explore plots and SPlots from any browser.
- Edit plot and SPlot information at any time.
- Rewards checker.
Technology
- Next.js with TypeScript, a React-based web framework for server-side rendering.
- Firebase Firestore as the NoSQL database, providing data from the cloud.
- Tailwind CSS with DaisyUI, a utility-first CSS framework for fast and easy customization.
- Amazon Amplify as the backend.
- Wallet clients - Facebook, Google, Albedo, WalletConnect, Freighter, and Rabet providing wallet client integration.
- Stellar SDK for checking user account details.
- Zustand for frontend state management.
Team
- Jose Urquiza, @hollowvox: Founder and CEO - Action Tokens
- Biplob Kumar Sutradhar, @biplobsd11: Lead Developer.
- Arnob Dey, @arnob_016: Design and Project Manager
- Md. Zonaid, @iH_Zonaid: Developer
Results
Now, Action Tokens users can easily visualize their plots and SPlots on their screens and upload images, edit information, and showcase their plots to the world.
Conclusion
In conclusion, our utilization of Next.js, Firestore, Tailwind CSS, Stellar and Amplify has enabled us to provide a visually appealing grid view of plots and SPlots. This user-friendly interface empowers users to effortlessly manage their plot information through the My Plot page and share their creative expressions with the broader online community within the Action Tokens ecosystem.